It is no doubt the US economy is heading towards the needed recovery as seen by the published macroeconomics data since the past 2 months. Just yesterday (13th Jan 2012), the US consumer-sentiment index reached 74 in the preliminary reading for January, compared with 69.9 in December.
Jobs growth reached 200,000 in December, 4.7% higher than the prior year.Mortgage rates have hit record lows. The average rate on the 30-year fixed-rate mortgage fell to a record low of 3.89% in the week ended Jan. 12, compared with 3.91% in the prior week, according to Freddie, a buyer of residential mortgages. These data go back to 1971. A year ago, the 30-year rate was at 4.71%.
Earlier US retail sales report also showed that America’s retailers enjoyed a record 2011 and their first $400 billion sales months ever. Steady sales gains have fueled a 20 percent surge from the low during the Great Recession. Monthly sales are even 6 percent above their pre-recession. Federal Reserve also issued a report saying the final six weeks of 2011 were among the economy’s best last year. The report pointed to higher holiday and auto sales, along with increased travel.
The only reversal seen was the nation’s trade deficit, which has widened 10.4% in November to $47.8 billion. This is the largest increase since May and indicates that US nationals are spending more on foreign goods/services.
Looking at the the US stock markets, most investors should revert their investing attention post holiday seasons and establish their new portfolio into the FY2012.
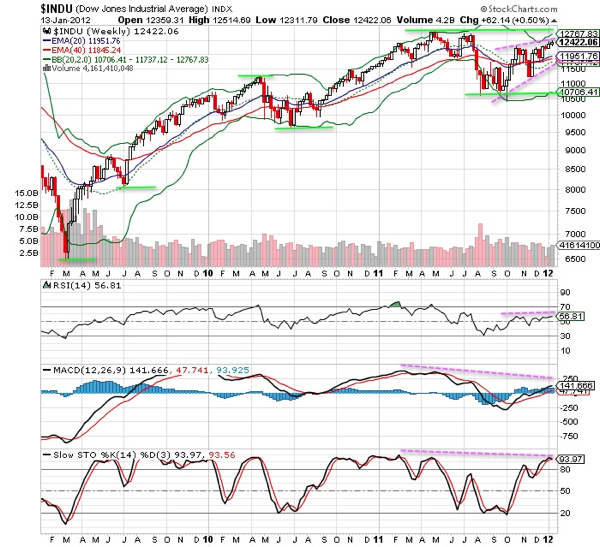
The weekly technical chart of Dow Jones Industrial Average shows consolidation phase since mid 2011. The bull trend ended since its takeoff from early 2010. Any further improvement in macroeconomics, the indices should propel past the strong resistance at 13,000, while short term consolidation should be kept within 12,500 and 11,900.

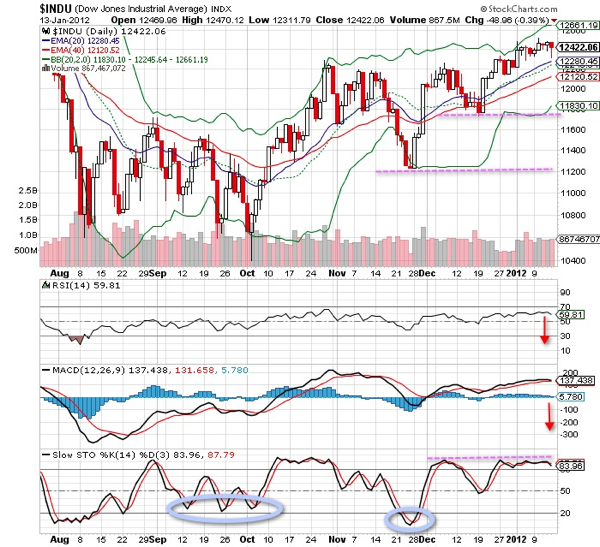
Zooming into the daily technicals, the indices should suffer negative bias with indicators showing bearish divergence and at overbought levels. Good entry should be towards 12,200 or 11,900.

Right now, developments in the Euro zone should still be the key influence on any possible significant recovery to the US fragile economy. As investors, we should stay vigilant and take any short term profits while aim for good long term re-entry or adaptive portfolio adjustments.
Read other related posts:
General disclaimer : The author has based this post on information obtained from sources which he believes to be reliable. He does not make any representation or warranty nor accept any responsibility or liability as to its accuracy, completeness or correctness. This post is not intended to be an offer, or the solicitation of any offer, to buy or sell the securities referred to herein.
Follow us on:
Share this article on:

