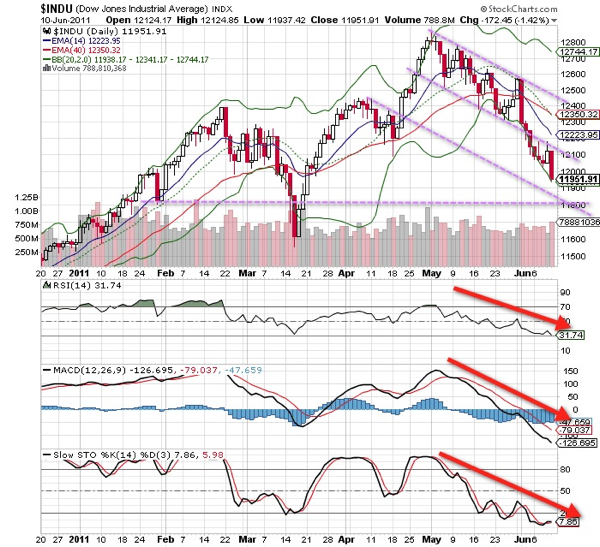
The market is still digesting that there’s been a softening in economic growth in the U.S. and other parts of the world. This is not surprising as there are signs of bearish divergences in most of the indices technical chartings.
The six-week losing period, which has knocked 6.7% from the Dow, is the longest stretch since October 4, 2002, when the index lost 15%.
Stocks extended their weekly decline yesterday after prices of goods imported into the U.S. unexpectedly rose, U.K. manufacturing dropped more than economists forecast and Chinareported a less-than-estimated $13.1 billion trade surplus in May as surging imports added pressure for higher interest rates in the world’s second-largest economy.
The Dow Jones Industrial Average fell 172.45 points, or 1.4%, to 11,951.91, its lowest close since March 18.
The S&P’s 500 Index ended down 18.02 points, or 1.4%, to 1,270.98. It’s lost 2.2% for the week, its sixth straight loss, or the longest weekly losing stretch since July 2008.
The Nasdaq Composite Index shed 41.14 points, or 1.5%, to 2,643.73, losing grip on year-to-date gains. The Nasdaq Composite has fallen for five of the past six weeks.
The dollar rose 1% against the euro EURUSD and also strengthened against a basket of six currencies
A) Dow Jones Industrial Average – Technical Chart / Analysis:
When the crucial support channel at 12250 was breached, it promises more weakness towards the next support target at 11800. All indicators are moving southwards with none showing signs of comfort for near term reversal. Dow Jones Industrial Average should persist till further good news arrive.

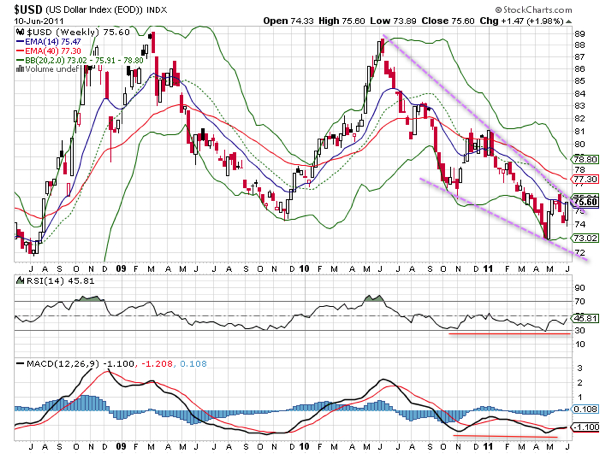
B) $USD USD Index – Technical Chart / Analysis
Mentioned in my earlier post, there is a nice bullish divergence during the lows formed in May and the USD index has nicely rebounded in recent weeks, testing the MAs at 76. On the backdrop of world wide risk divergence, there should be a sustained strengthening of USD against major currencies.


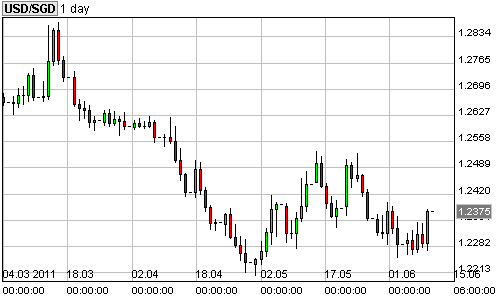
Gauging at persistant strength in USD/SGD, it maybe worthwhile to considering gaining some exposure to good US Stocks whose valuations have improved during recent price correction. Short term resistance will be pegged at 1.255.
Keep close watch of some key economic data which will be released throughout next week (listed in GMT+8 timings):
Tuesday – Producer Price Index, Retail Sales, Business Inventories
Wednesday – Consumer Price Index, Empire State Manufacturing Survey, Industrial Production
Thursday – Housing Starts, Jobless Claims
Friday – Consumer Sentiment index
Read other related posts:
Follow us on:
Share this article on:

