Political & economic situations should see some light of stability in coming week. Apart from movements in global stock markets, futures market should see further price swings. More importantly, there will be important US economic data to be released this coming week:
– Jobless Claims (Thurs)
– GDP, Consumer Sentiment (Fri)
CRUDE OIL
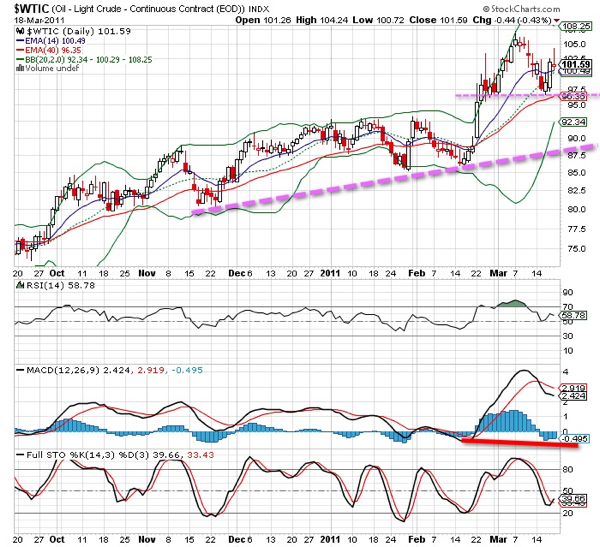
Crude oil has breakout of $93 and since then it has undergoing some consolidation between $96.3 and $108.3. Long term uptrend is still intact with near term support at $100.4. RSI & STO indicators point towards immediate recovery from oversold levels but MACD showing some conflicting signal of bearish divergence. Upwards correction may not be sustainable.

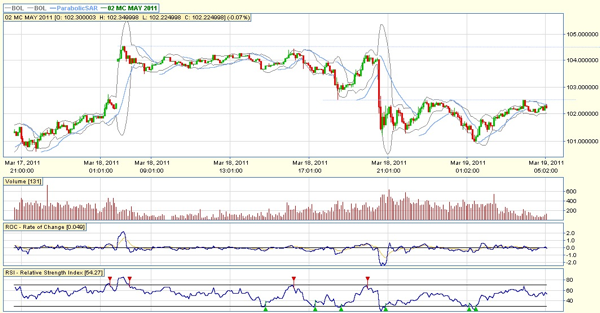
On the 5mins frame of May 11 Minicrude chart, volume for price recovery is not strong. Resistance will be at $102.5 and next at $104.5. Good entry point towards $100.5 – $101.5.

GOLD
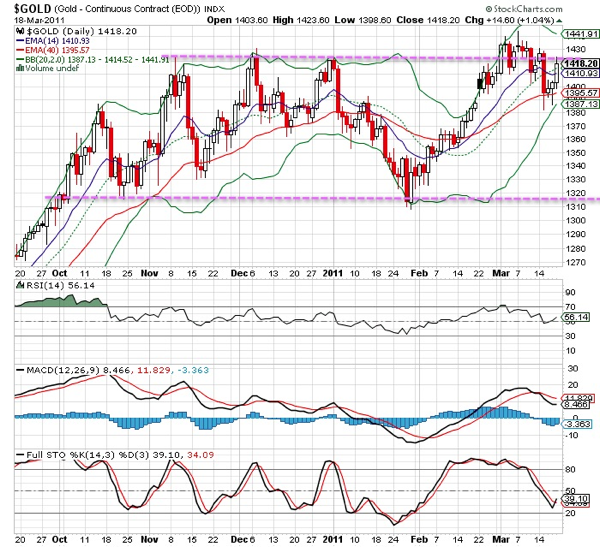
Since Oct 2010, Gold has been undergoing some consolidation between $1315 and $1420. Resistance at $1420 is strong with 4 peaks tested and failed to gain significant breakouts. Near term support remains at $1390.

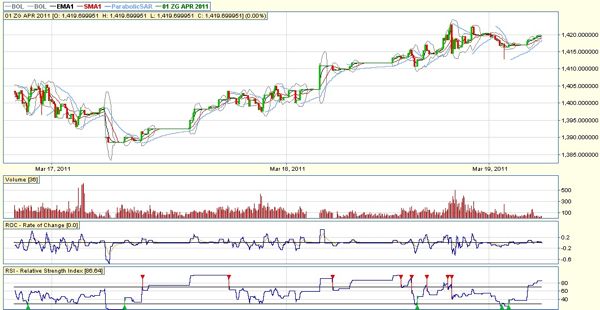
5-mins intraday wise, significant recovery started from May 17th. $1405 to be retested in coming week.

Read other related posts:
Follow us on:Share this article on:

