On Wednesday 22nd June 2011, Greek Prime Minister George Papandreou’s government survived a confidence vote in parliament. This piece of news has injected the needed confidence among the investors who underwent financial market turmoils for the past few weeks.
European leaders breathed a sigh of relief but kept up the pressure on Greek Prime Minister George Papandreou, who faces a vote June 28 to push though more spending cuts, tax hikes and asset sales. Still, fearing the financial chaos that any Greek default would ignite, EU leaders promised Papandreou additional funds to help the shrinking Greek economy to get back on its feet.
Greece’s creditors, particularly its partners in the 17-country eurozone, are demanding that Papandreou get parliamentary approval for €28 billion ($40.24 billion) in budget cuts and new taxes and for a €50 billion ($72 billion) sell-off of government assists by the end of June. Only then will they hand over €12 billion ($17 billion) in bailout funds that Greece needs to avoid bankruptcy in mid-July.
This set stage to define the movement of our local Singapore stock market even though the last set of Singapore GDP is still impressive. Singapore 2012 GDP growth is still forecasted to be at 5.5%, while CPI inflation is expected to come in at 2.5%.
Singapore’s economic growth outlook is set at a decent 6.2% for the full-year 2011 which is upgrade from the 5.7% forecast in the previous poll of economists by the Monetary Authority of Singapore, released in March.
The economic growth would be supported by the manufacturing and financial services sectors, said the Monetary Authority of Singapore’s (MAS) latest quarterly Survey of Professional Forecasters.
On the backdrop of significant external knee-jerk influences, it would be interesting to observe how the Straits Times Index (STI) has been trending for the past weeks:
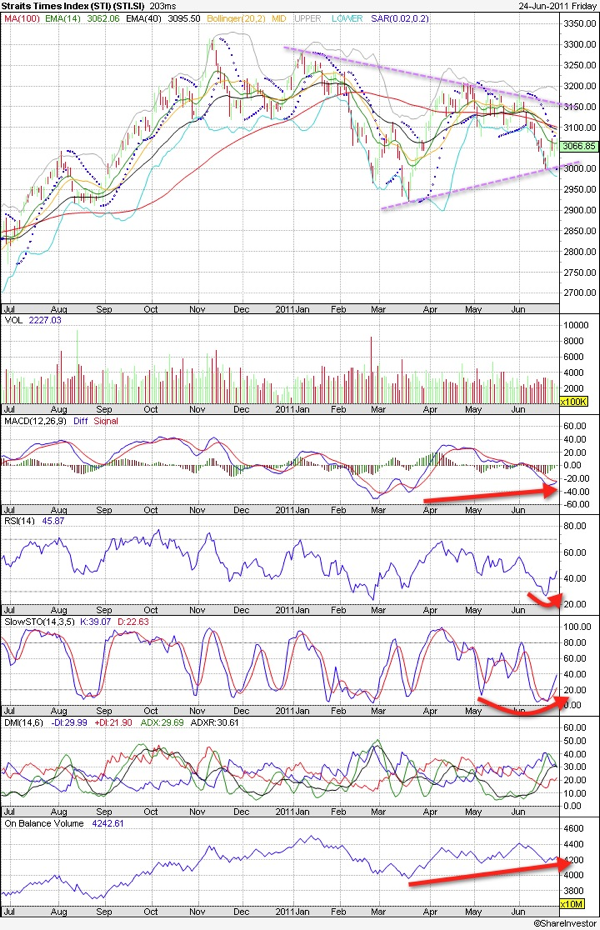
STI continues its index consolidation in a wedge formation. Now level 3000 is crucial support. Failing which, STI should correct further to 2900. To some comfort, there are signs of bullish divergences in key indicators, signifying some levels of bargain hunting. STI can only resume some bullish activity if it closes above 3100 with solid trading volumes.
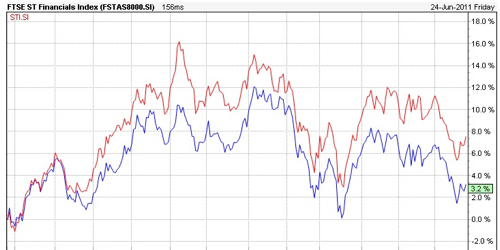
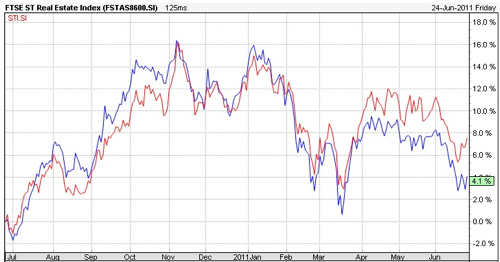
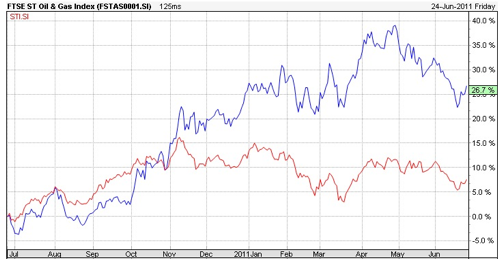
Lets now take a closer look at various sector performances vs the STI to determine value buys (RED – STI, BLUE – Sector of concern):
a) Financial Sector
b) Real Estate / Property
c) Oil & Gas
d) Maritime
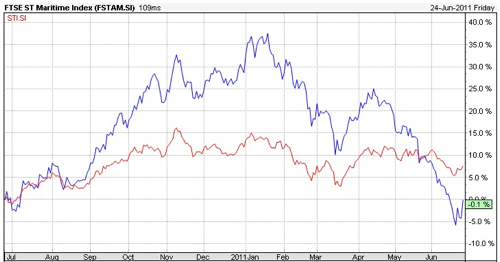
As seen, Oil & Gas stocks are still very much a premium since early days. Financial & Property stocks seem to be the most appropriate play when value differences close during overall market recovery.
Read other related posts:
Follow us on:
Share this article on:

