Since weeks back, I have cautioned all to be nimble about stock market movements lead by the rising negative developments in Libya unrest. Oil production has been disrupted causing oil futures to surge to record high since 2009 and investors rushing into safe haven via USD & Yen, prompting rising strength in both.
The latest comforting news are worth to note:
a) It is believed that the Saudi state oil company had increased its output to more than 9 million barrels per day – a rise of more than 700,000 barrels. The worsening situation in Libya has led to a loss of about 1.2 million barrels out of its 1.6 million barrels of daily output.
b) Air India will fly two planes to Tripoli tonight to evacuate about 18,000 Indians stranded in strife-torn Libya.
Coupled with not so drastic movements in US Stock market and short term reprieves in Oil futures, we should gain some market stability in next few weeks.
On Singapore front, indeed overseas funds has been retracting with a plummet of STI within a short 1 week. Likely, funds are shifting to safe haven and squaring of leverages. Near term weaknesses should continue and hopefully consolidation period will be short before we resume any uptrend.
Do watch out for further economic developments and market movements. It pays to be steady but be ready to cut if stop losses are breeched.
Good luck!
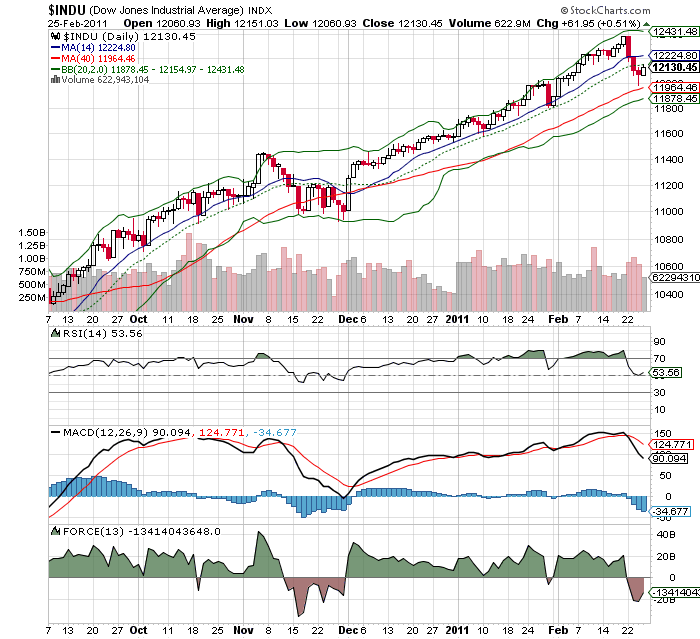
Chart 1 : Dow Jones Industrial Index (Near term consolidation, uptrend intact)
– No major reversal for uptrend since Dec 2010.
– Minor reversal expected with hammer formation.
– Support at 11950 should hold for awhile
– Good uptrend if index can free above 12250
– Short term reprieve from correction in MACD & Force Index

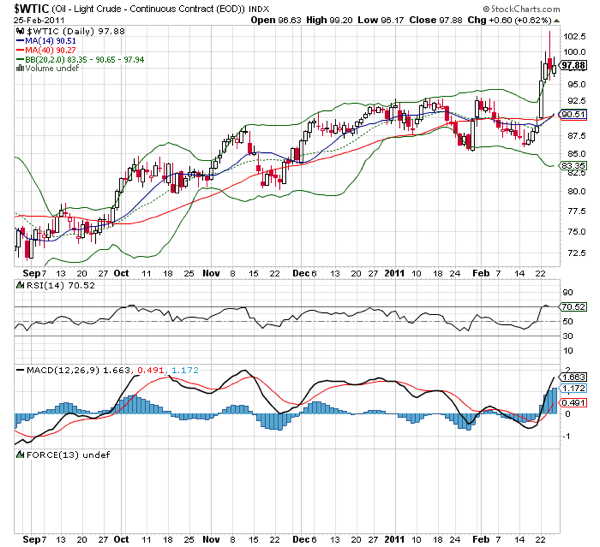
Chart 2: Light Crude Oil (Consolidation should take place)
– Close shooting start formation exhibits reversal strength in midst of uncertainty
– Oil price should consolidate between (US$93 – US$100). Short term support at US$92.

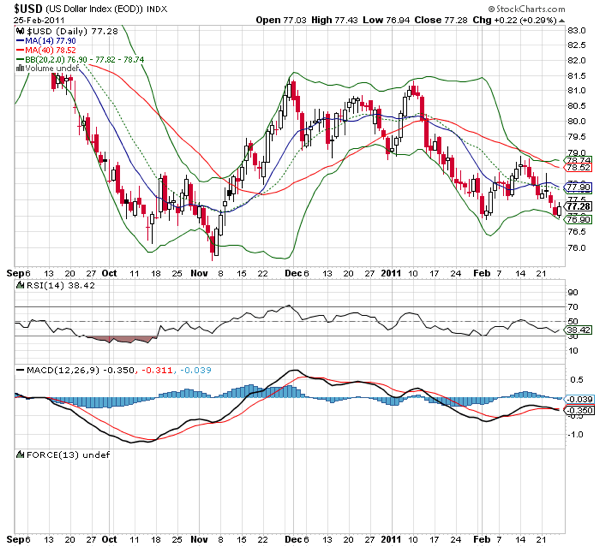
Chart 3: USD Index (Have near term support, weakness should resume)
– Chances of double bottom if support 76.5 holds.
– Near term resistance for USD weakness will be at 79

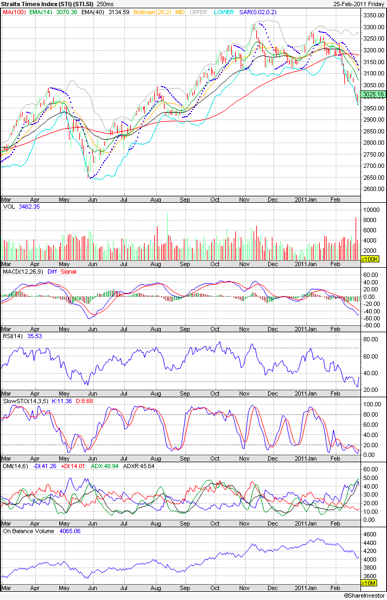
Chart 4: Straits Times STI (Weakness should persist for awhile)
– Minor hammer formation if 2960 holds. This will bole well for a needed reversal.
– Next resistance at 3100
– Selling should slow down with RSI reversal and OBV decline
– Bearish sentiment should stay for a while till a distinct reversal of MACD

Related posts:
i) 21st Feb 2011 – Gold & Oil Prices
ii) 15th Feb 2011 – STI chart & trends
%RELATEDPOSTS%
Follow us on:Share this article on:

