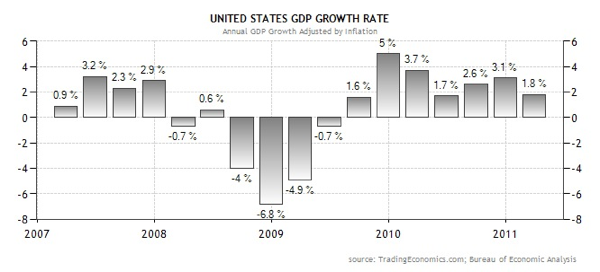
Last night (29th April 2011), US released their latest US GDP economic data which shows that United States GDP increased at an annual rate of 1.8 percent in the first quarter of 2011. In the fourth quarter, real GDP increased 3.1 percent.
The positive contributions came from:
– personal consumption expenditures (PCE)
– private inventory investment,
– exports, and
– nonresidential fixed investment
The negative contributions came from
– federal government spending
– state and local government spending
The detailed changes in each of the GDP components are:
a) Motor vehicle output added 1.40% to the first-quarter change in real GDP after subtracting 0.27% from the fourth-quarter change.
b) Final sales of computers added 0.12% to the first-quarter change in real GDP after adding 0.35% to the fourth- quarter change.
c) Real personal consumption expenditures increased 2.7% in the first quarter, compared with an increase of 4.0% in the fourth.
d) Durable goods increased 10.6%, compared with an increase of 21.1%.
e) Nondurable goods increased 2.1%, compared with an increase of 4.1%.
f) Services increased 1.7%, compared with an increase of 1.5%.
g)
Real nonresidential fixed investment increased 1.8% in the first quarter, compared with an increase of 7.7% in the fourth.
h) Nonresidential structures decreased 21.7%, in contrast to an increase of 7.6%.
i) Equipment and software increased 11.6%, compared with an increase of 7.7%.
j) Real residential fixed investment decreased 4.1%, in contrast to an increase of 3.3%.
k) Real exports of goods and services increased 4.9% in the first quarter, compared with an increase of 8.6% in the fourth.
l) Real imports of goods and services increased 4.4%, in contrast to a decrease of 12.6 percent.
Real federal government consumption expenditures and gross investment decreased 7.9% in the first quarter, compared with a decrease of 0.3% in the fourth.
m) National defense decreased 11.7%.
n) Nondefense increased 0.1%
o) Real state and local government consumption expenditures and gross investment decreased 3.3%.
p) The change in real private inventories added 0.93% to the first-quarter change in real GDP after subtracting 3.42% from the fourth-quarter change.
q) Private businesses increased inventories $43.8 billion in the first quarter, following increases of $16.2 billion in the fourth quarter and $121.4 billion in the third.


This is possibly why Bernanke on 28th April 2011 disclosed that the Fed plans to freeze the size of its balance sheet once it has completed its $600 billion bond-buying program. This is accomplished by reinvesting maturing mortgage-backed securities and Treasurys.
During the press conference, Bernanke said he didn’t know when the Fed would tighten interest rates and that language in the Fed’s statement on “extended period” for keeping low rates suggests that the central bank would wait at least a “couple of meetings” before acting — in other words, August or September.
“Extended period is conditioned on resource slack, on subdued inflation and on stable inflation expectations,” Bernanke said. “Once those conditions are violated or we move away from those conditions, that’s the time we need to begin to tighten.”


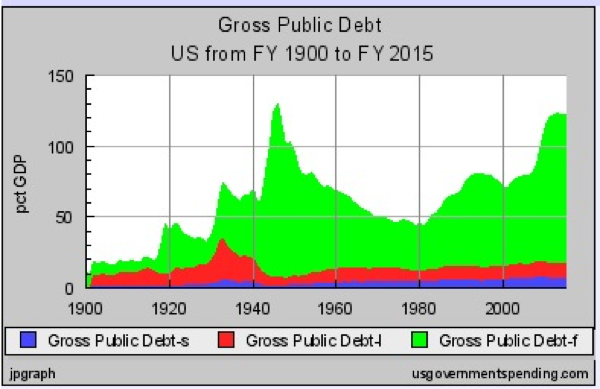
After World War I, the federal debt surged to 35% of GDP. But by the mid 1920s federal debt had declined to below 20 percent of GDP with state and local debt rising to 16 percent of GDP.
Then came the Great Depression, and President Roosevelt decided to spend his way out of trouble, boosting federal debt to 40 percent of GDP. So did the local governments, with state debt peaking at over 5 percent of GDP in 1933 and local debt peaking at over 28 percent in 1933. Government debt, including federal and state and local debt rose to 70 percent of GDP.
But it was World War II that really entered new territory. After the end of the war in 1946 federal debt stood at almost 122 percent of GDP, with state and local debt adding another 7 percent. For the next 35 years successive governments brought down the debt, but then came President Reagan.
He increased the federal debt up over 50 perent of GDP to win the Cold War. President Bush increased the debt to fight a war on terror and bail out the banks.
President Obama is increasing it to fund anything that needs a cool trillion or so.
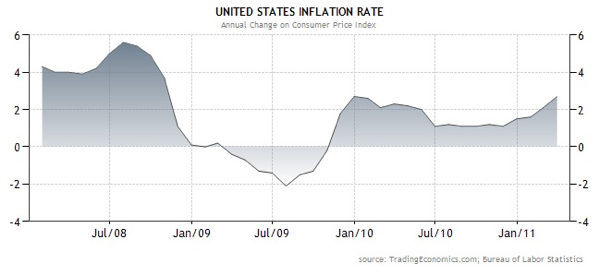
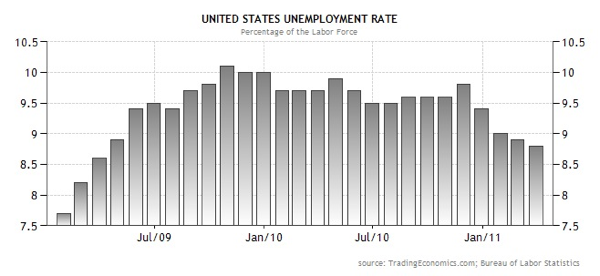
In summary, with inflation rate climbing towards highs, stubbornly high unemployment rate, weak GDP data and rising Government debt near historical highs, US Central funds should hold interbank rates for awhile. USD should continue its recent weakness.
Read other related posts:
Follow us on:
Share this article on:

