After the Singapore Elections 2011, now it is the time to re-focus on the growth potential of Singapore Economy. As domestic activities increase, banks will be the key group of stocks to benefit, DBS has the greatest PE of 20 while UOB has the lowest PE of 11.4.Net earning growth % is the strongest in UOB. Based on the fundamentals and technicals of the three banks, DBS has always been the gem in most funds investors, but it pays to watch out for price trend reversals in either OCBC or UOB.
Latest financial results/news:
i) DBS Stock Financial Results / News (D05.SI)
29th April 2011 – Qtr net profit S$807 mil against S$532 mil last year same Qtr. Beats expectations on falling bad-debt charges, strong investment banking fees and a surge in trading income.
ii) OCBC Stock Financial Results / News (O39.SI)
11th May 2011 – Qtr net profit S$628 mil against S$676 mil last year same Qtr. Exceeds market expectation of S$582 on strong loans.
iii) UOB Stock Financial Results / News (U11.SI)
6th May 2011 – Qtr net profit S$612 mil against S$700 mil last year same Qtr. Slightly below market expectation of $625 mil due to weak interest margin.
Latest technical analysis:
A) DBS Stock Technical Analysis (D05.SI)
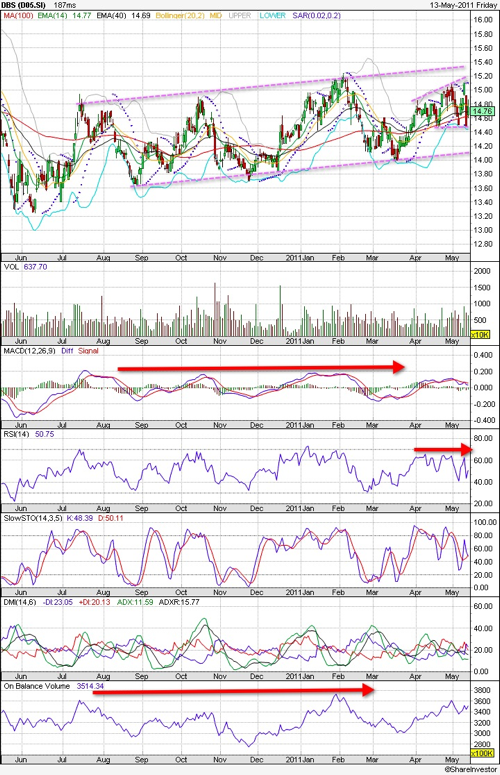
DBS stock has been consolidating on a slight upward channel since Aug 2010 within a moderate band width of $1.00. Lately from Apr 2010, it formed a reverse wedge and is poised to a short term reversal to test the channel support at $14.10. DBS stock trading volume has been moderate and indicators have been lacklustre, flattening at peaks, thus pointing that the consolidation could take awhile longer. Channel resistance will be at $15.40.
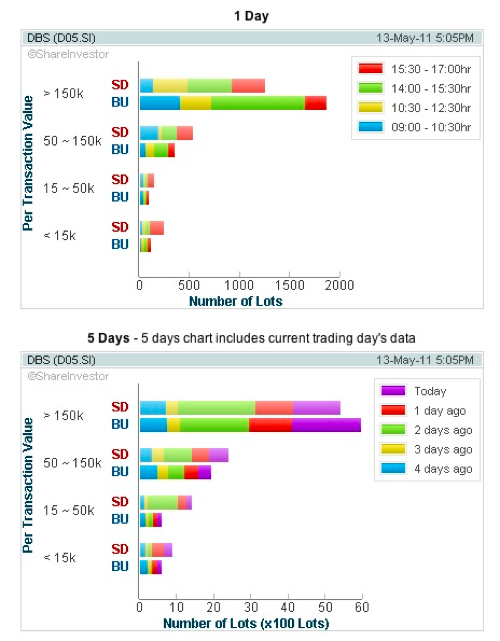
Trading volumes are healthy with the fund investors, biased towards some accumulation. Small retail investors are taking profit.
B) OCBC Bank Technical Analysis (O39.SI)
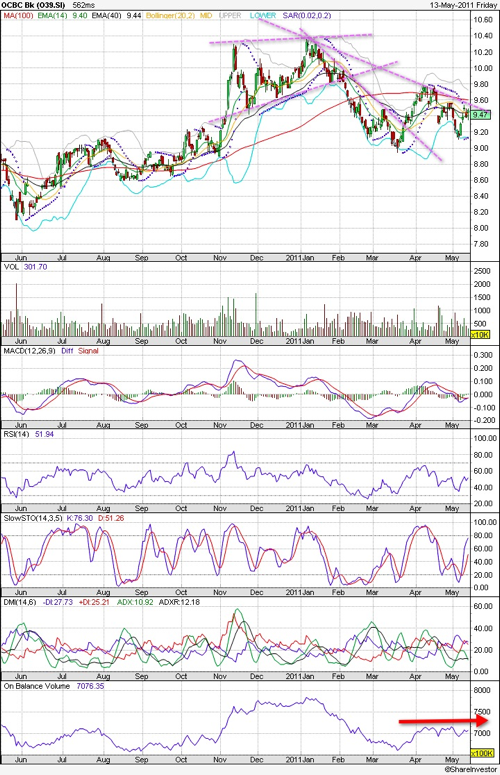
On the other hand, OCBC has suffered a price downwards breach at $9.9 during Jan 2011 and OCBC stock price corrected downwards towards $9.00 target. Near term support must hold at $9.20 else more price correction will take place. To resume upward price trend, OCBC price must clear the $9.60 resistance and price can resume towards $10.40.
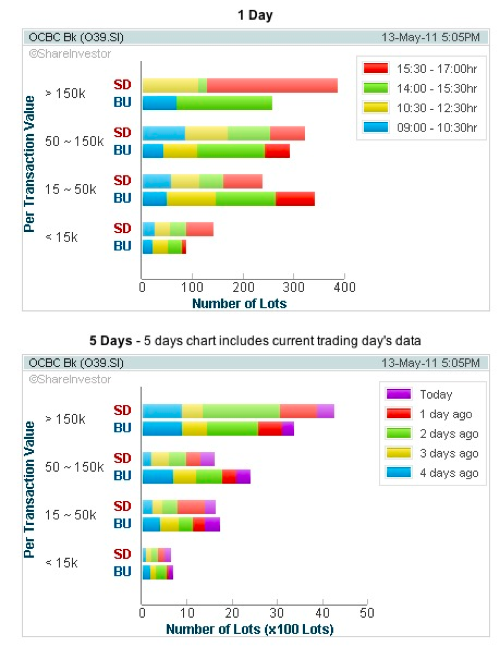
Funds managers are net sellers with retail investors holding up the support.
C) UOB Bank Technical Analysis (U11.SI)
Similar to DBS, UOB stock price is also undergoing consolidation for a period since Jan 2011. Key support is at $18.90 while strong resistance will be at $19.90. No trending observations for the various indicators and any further price movements have to be readily supported by improved technical indicators.
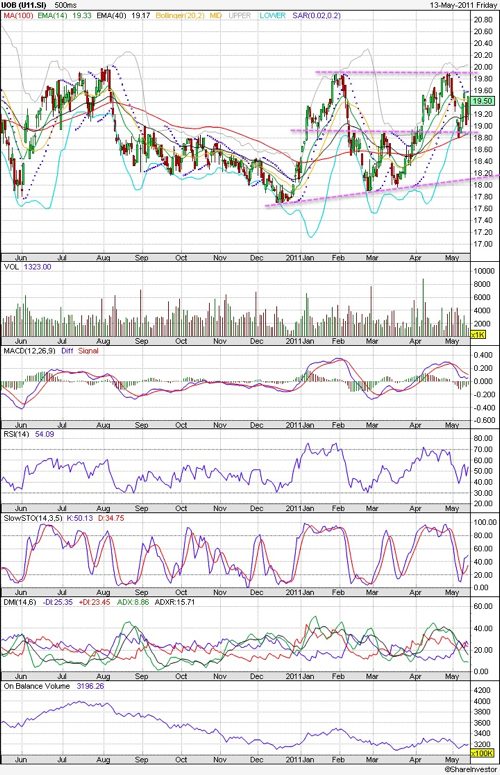
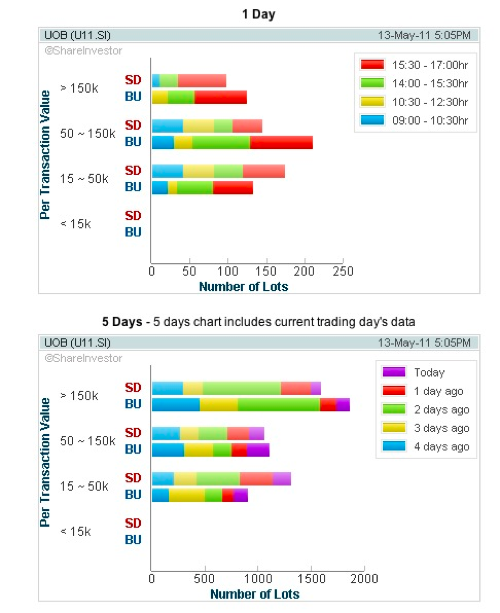
More comforting note is that there are net significant buyers for the UOB stocks to accumulate during its price weakness.
Read other related posts:
Follow us on:
Share this article on:

