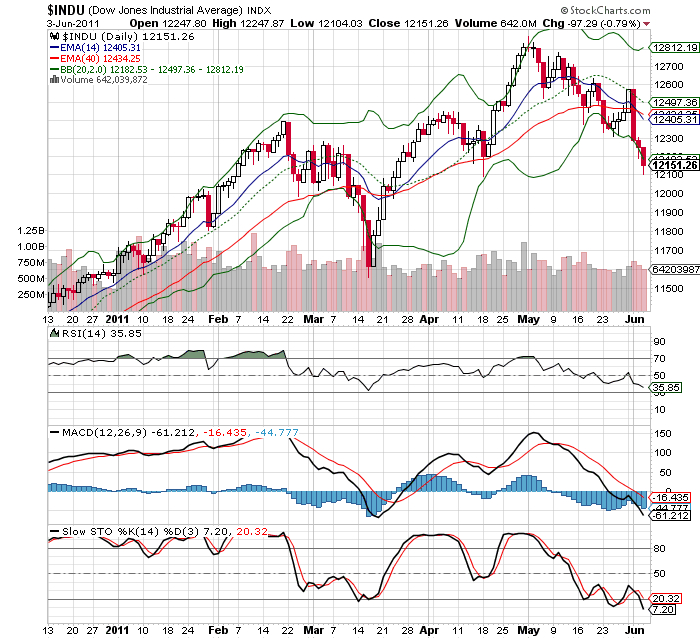
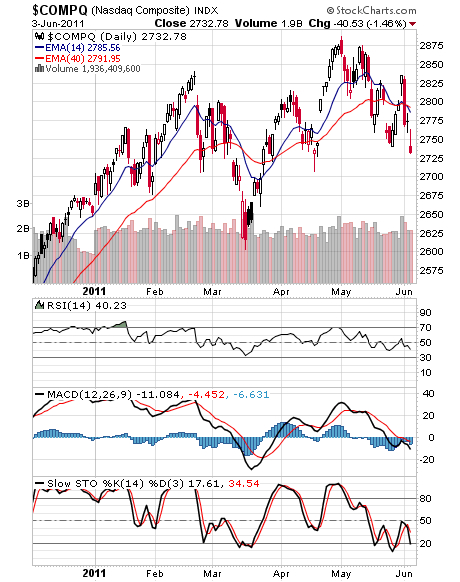
For the week ending last Friday, most bourse indices has hit significant weeks low and US stock indices were down for consecutive 5 trading days on the backdrop of weak US & China economic data. Further downgrades of Greece by S&P added further anxiety among investors.
Dow Jones Industrial index has breached the 2 important Moving averages and it should test the crucial 12000. Indicators are all weak towards oversold levels but does not reveal any signs of immediate rebound. Near term resistance will be at 12460.
Likewise, Nasdaq faces similar trending with next important support at 2710 to be retested. Resistance will be strong at 2810.
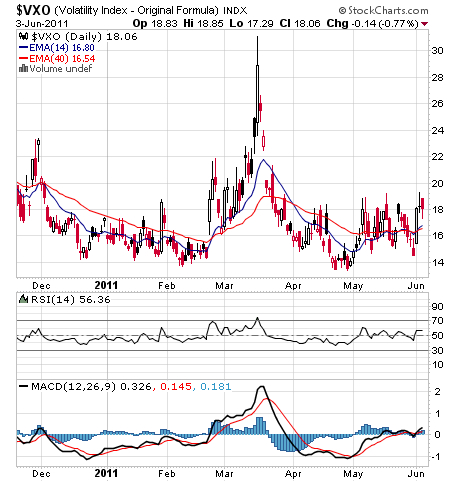
Generally, trend reversal holds well when Volatility index holds at low and stable level e.g. Back in mid April – May. Based on recent Volality Index at quite a moderately high level, it will require much risk appetite to go on aggressive average down accumulation strategy. That said, there are still good valued stocks which have already corrected favorably and are worth looking at for nice longer term entries especially during a low USD index.
Read other related posts:
Follow us on:Share this article on:


