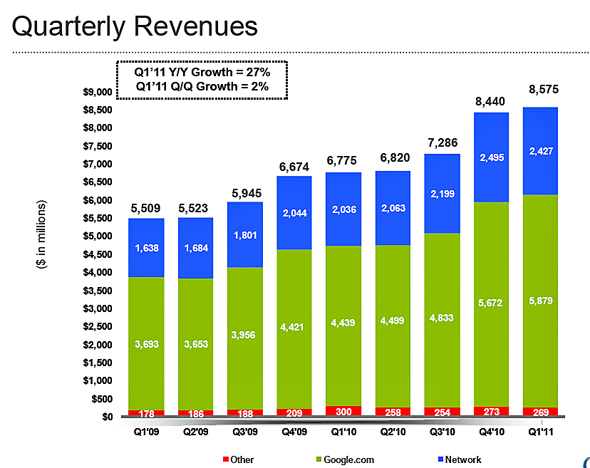
On 14th April 2011, the company has just reported $8.58 billion in gross revenue for the first quarter of 2011, which represents a 27% increase over the first quarter of last year, but lower than analysts’ expectations. The key product – Google Search is still strong with good retained user base while the new innovations – Google Android & Chrome are doing very well with good growth in new user base.
Heading into some of the key highlights of the financial & product analysis listed below.
A. Quarterly Revenue
Q1 yr-on-yr 27% growth was impressive.
Key Financial Statistics:
– Gross Revenue of $8.58 billion was slightly better than expected and rose a strong 27% year over year.
– Net Revenue of $6.54 billion slightly better than expected.
– Adjusted EPS of $8.08 is slightly below expectations of $8.13.
– Revenue per click increased 8% year over year, at the high end of expectations.
– Free cash flow was a solid $2.2 billion.
– Android is getting 350,000 activations per day. Chrome now has 120 million users — that means 120 million people who are more likely to be “locked in” to Google services. YouTube revenue is doubling every year.
Google Sites Revenues : Google-owned sites generated revenues of $ 5.88 billion (69% of total revenues), a 32% increase over Q1 2010 revenues of $4.44 billion.
Google Network Revenues : Google’s partner sites generated revenues, through AdSense programs, of $2.43 billion (28% of total revenues), a 19% increase from Q1 2010 network revenues of $2.04 billion.
International Revenues : Revenues from outside of the United States totaled $4.57 billion, (53% of total revenues) compared to 52% in Q4 and 53% in Q1 2010. U.K. revenues totaled $969 million (11% of revenues), compared to 13% in Q1 2010.
Paid Clicks : Aggregate paid clicks, which includes clicks related to ads served on Google sites and the sites of Google’s AdSense partners, increased about 18% over Q1 2010 and 4% over the Q4 2010.
Cost-Per-Click : Average cost-per-click, which includes clicks related to ads served on Google sites and the sites of Google AdSense partners, increased approximately 8% over Q1 2010 and decreased about 1% over the Q4 2010.
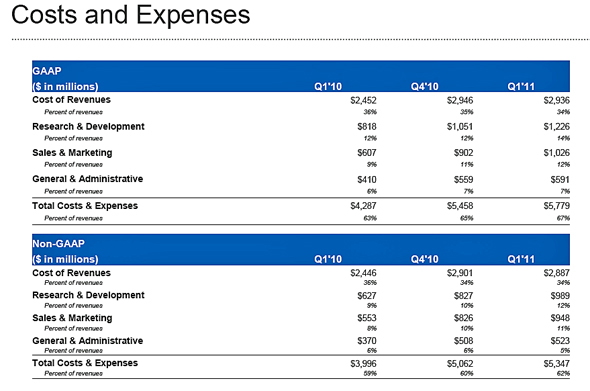
C. Costs and Expenses
Worldwide, Google employed 26,316 full-time employees as of March 31, 2011, up from 24,400 full-time employees as of Dec. 31, 2010.costs rising as a percentage of revenue, particularly R&D and sales and marketing.
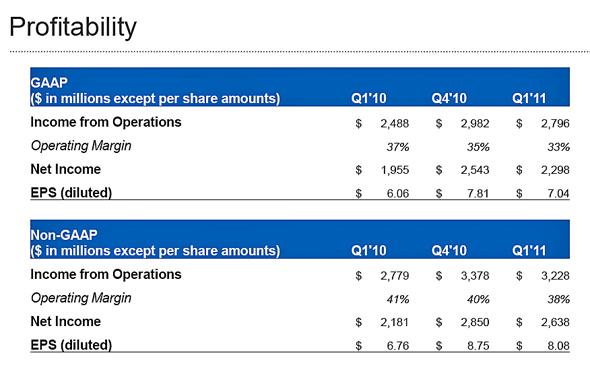
D. Profitability
Operating margins are getting lower.
Recent years, Google has been active in key innovations around 2 new product streams – Google Android and Google Chrome.
Let’s take a quick look at how the adoptions have faired which will gives us an indication of new user base growth and traffic sustainence.
I) Google Android in mobile arena OEM Market Share 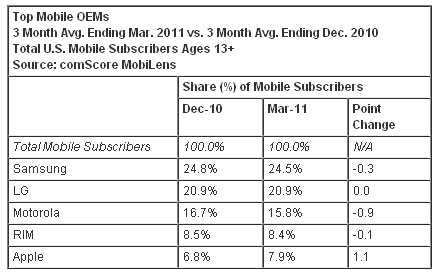
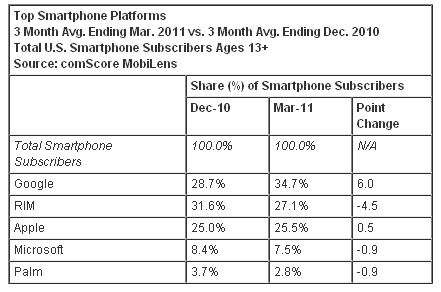
Smartphone Platform Market Share
In terms of devices reach, Google has good growth traction.
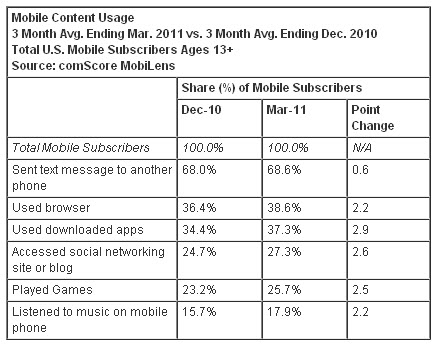
Mobile Content Usage
We can also see that with better smartphones, data transaction based activities have increased.
II) Google Chrome – Trends & Insights
April 2011 was the first time that Internet Explorer 9 and Firefox 4 were available for the full month which are HTML5 compliant. Thus, it would be a more comparable against Chrome adoption.
The implication from this is that the new browsers, though both substantial upgrades over their predecessors, are doing little to attract users of other browsers; the people switching to them are merely upgraders. Google Chrome has also garnered good traction ever since Aug 2010.
III) Search Engine Market Share (by comScore)
Based on comScore April 2011 reports, Bing continued its incremental growth for the eight straight month.
Out of the 16.2 billion searches conducted in April, Google ranked first with 10.7 billion searches, while Yahoo accounted for 2.6 billion, Bing came in third with 2.3 billion, Ask.com had 491 million, and AOL was last with 248 million.
Google search market share fell to 65.4% (down from 65.7% in March).Yahoo grew to 15.9% (up from 15.7%). Bing grew to 14.1% (up from 13.9%).
In short, Google Search as a product still holds well in significant dominance of loyal online users. Now lets look at its stock performance.
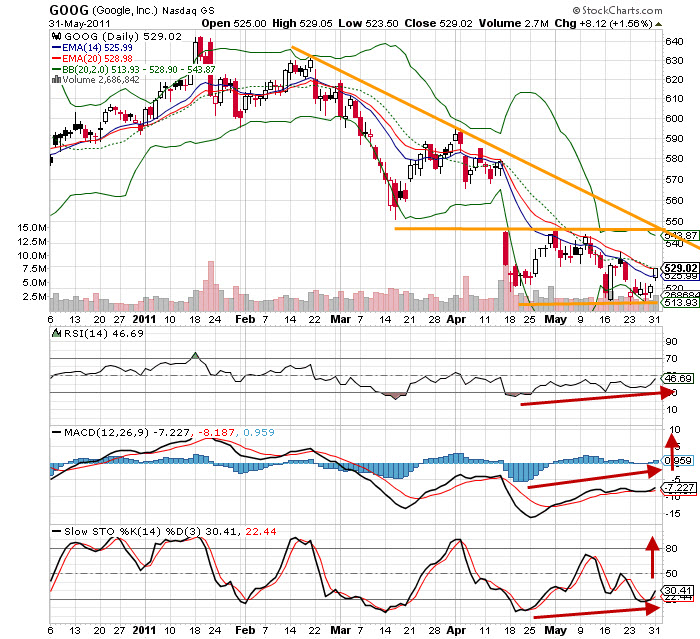
Google stock price has been disappointing since early Jan 2011 after the double top formation. Recent gap-down was due to lower than expected results in April 2011 which is unwarrented in my perspective.
After months of decline, it is now undergoing a consolidation phase with a bullish divergence in most indicators. Near term recovery should be in place once Google stock price has cleared convincingly above $530. The trend will reverse up once key resistance at $550 is breached. Short term support at $510 will be crucial to hold the consolidation phase.
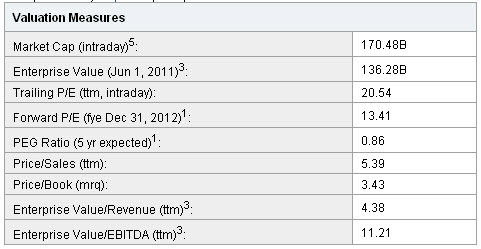
The current and forward PEs are also not very demanding (as extracted on 1st June 2011):
Read other related posts:
Follow us on:
Share this article on:


